CAPE and the next ten years
Robert Shiller's cyclically adjusted P/E compares the S&P 500 with ten years of inflation-adjusted earnings. I first met it in his Financial Markets course, so I took his data back to 1881 and checked how well it lined up with the real returns of the decade that followed.
- Built with
- Python, pandas, statsmodels
- Data
- Shiller's monthly S&P 500 data, 1871 to 2023
- Method
- Total-return index, OLS with Newey–West errors
Cheap markets did better
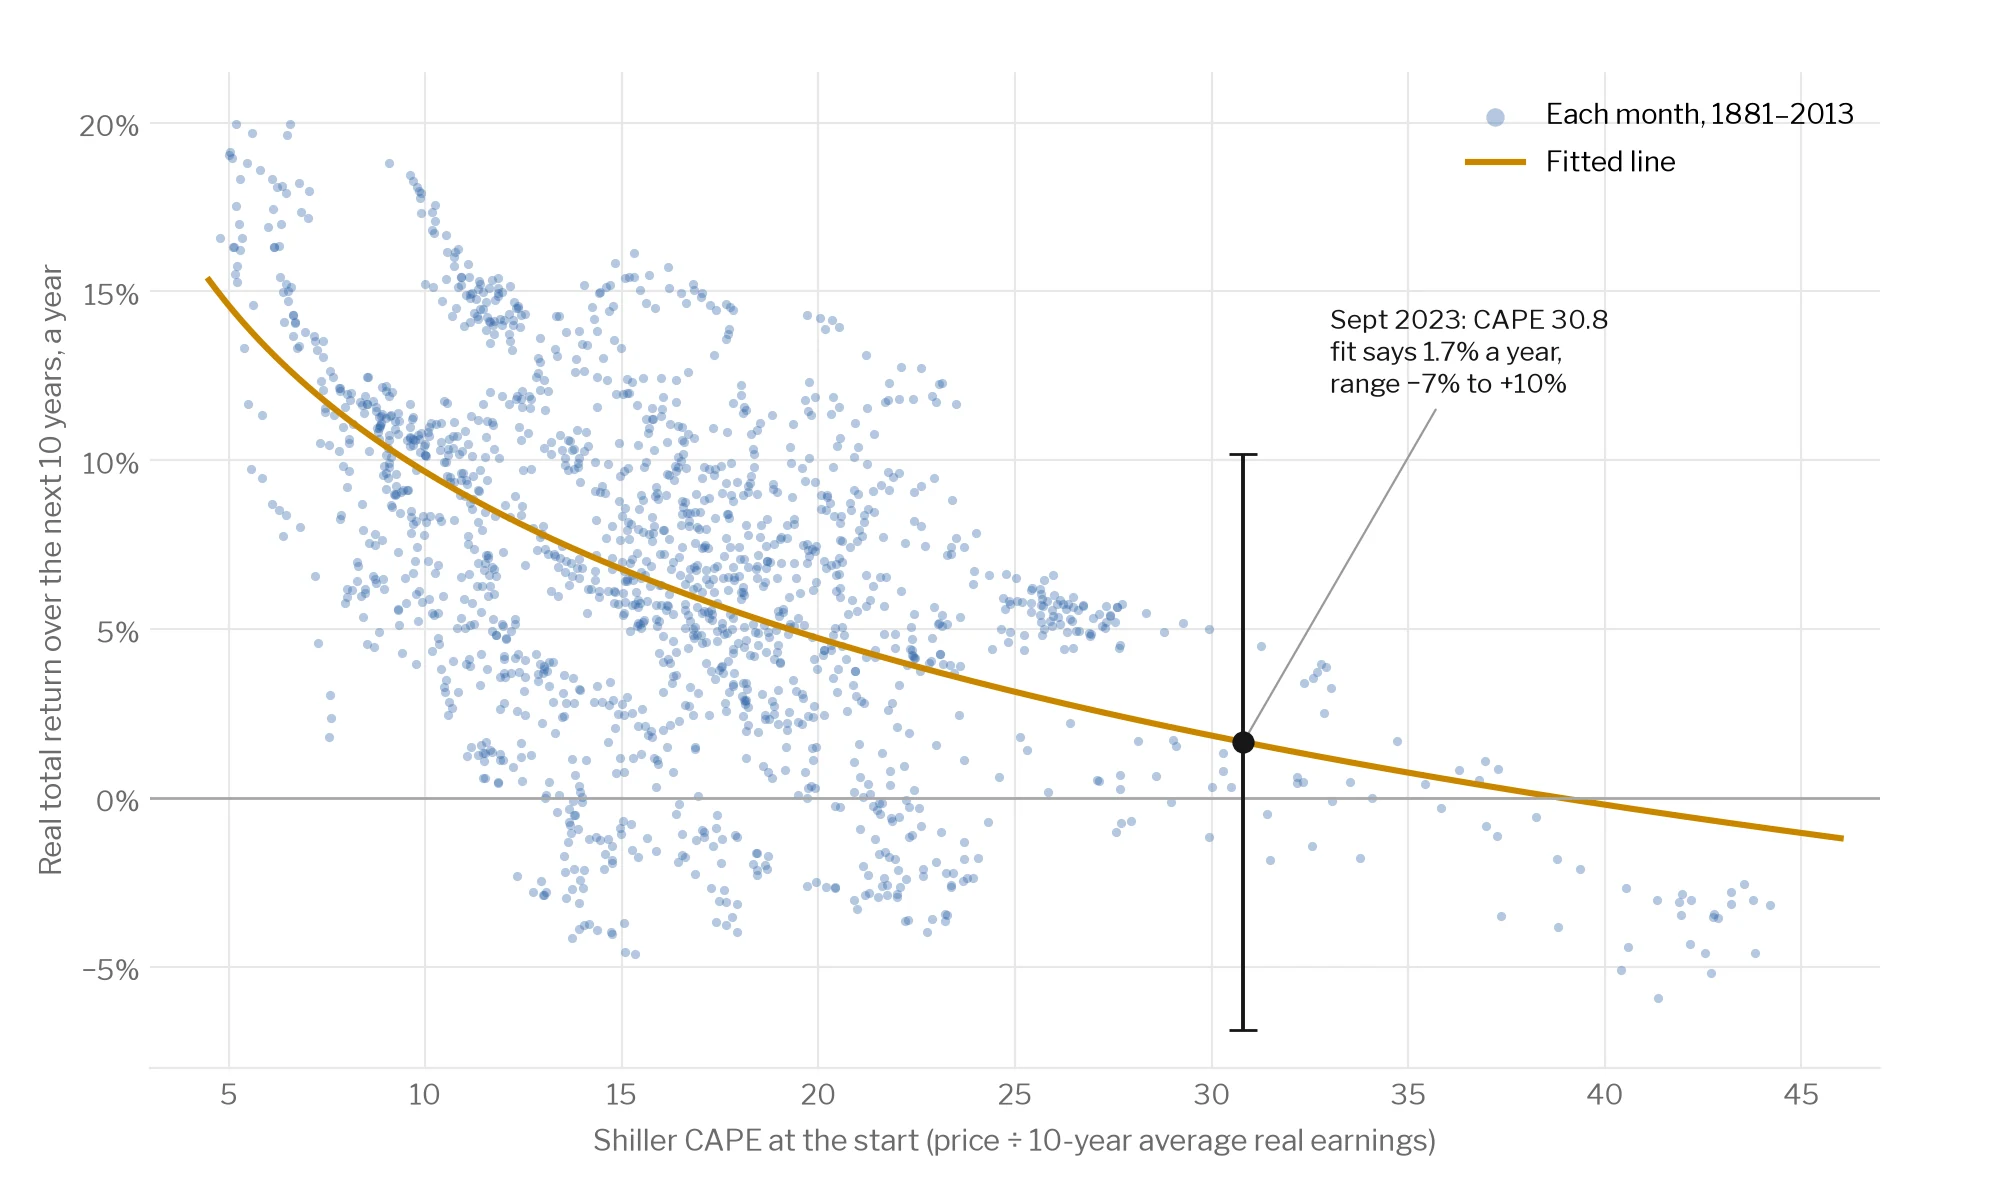
When CAPE was in its cheapest fifth (below 11), the next ten years returned 10.9% a year after inflation on average. In the dearest fifth (above 21) it was 3.0%.
The fitted line explains about 29% of the variation, which is a lot for one number, but the spread around it is wide. The dearest fifth still ranged from −5.9% to +13.1% a year.
How I'd use it
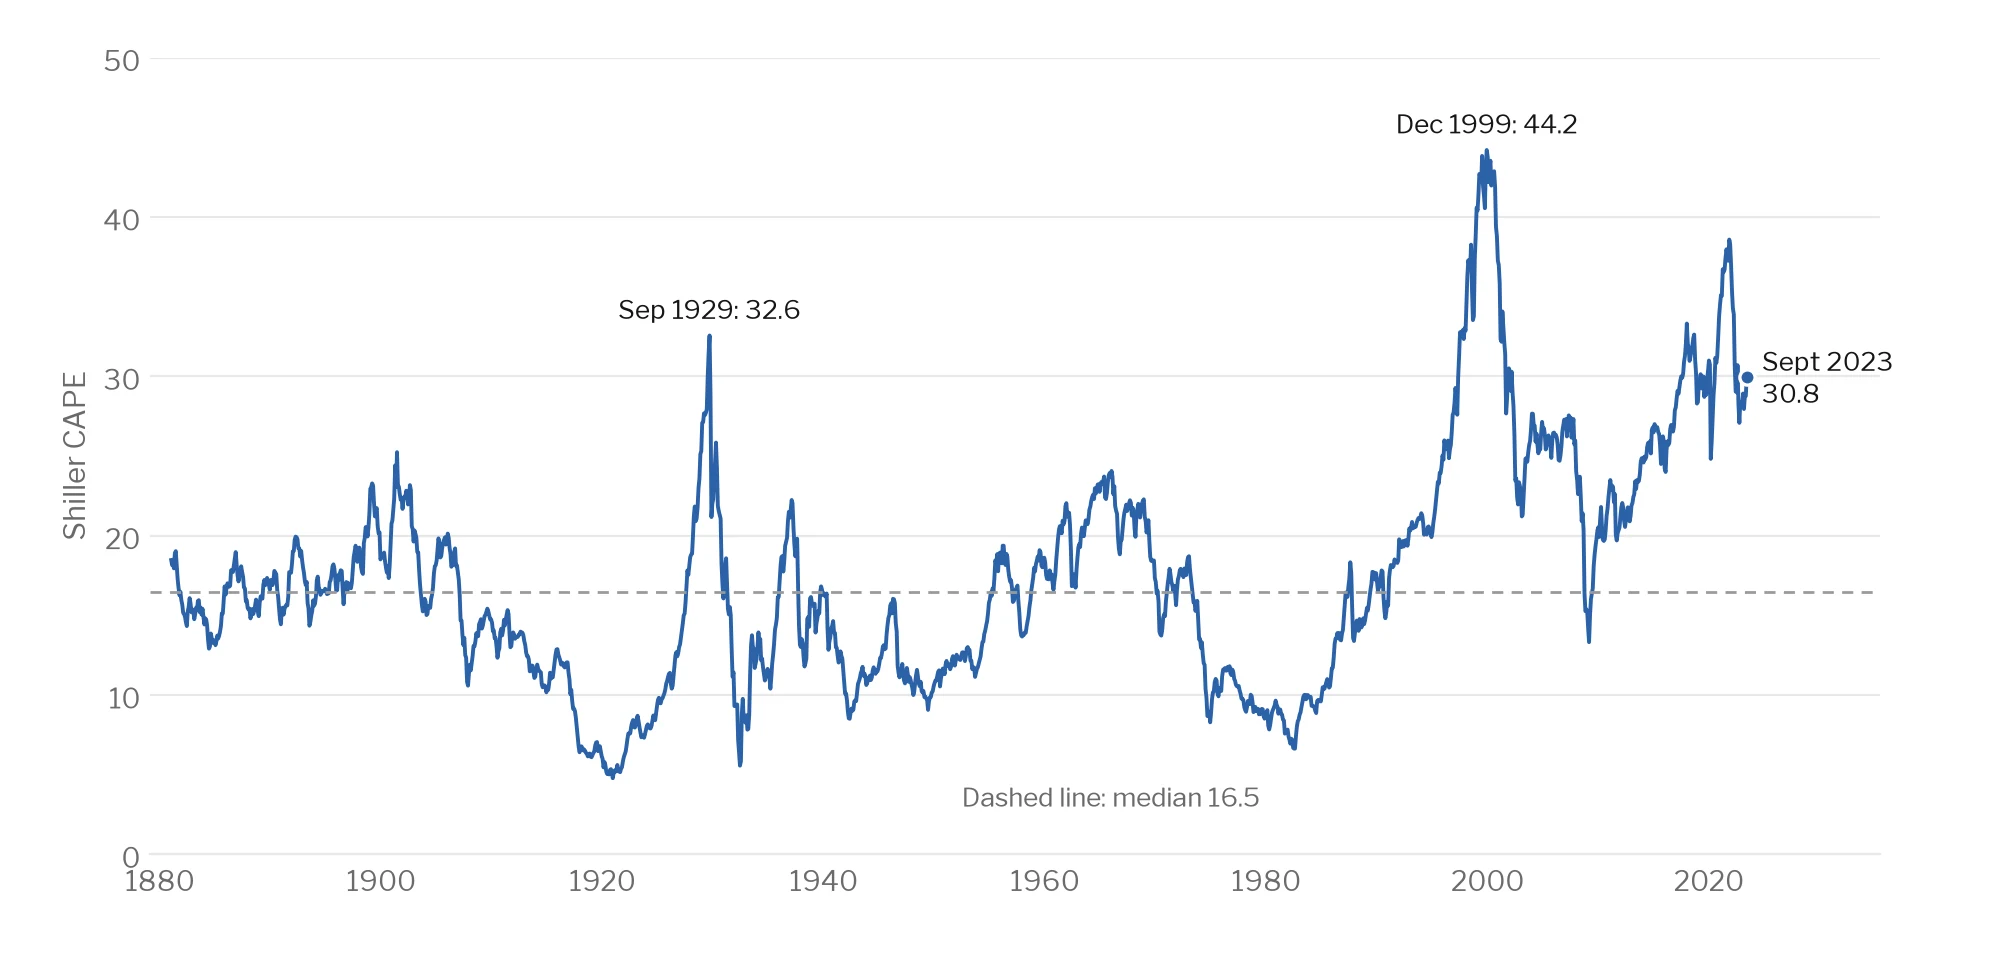
At the end of the data, September 2023, CAPE was 30.8, higher than 95% of past months. The fit pointed to about 1.7% a year after inflation for 2023 to 2033, with a range of roughly −7% to +10%.
Three years in, the market has run well ahead of that: the S&P 500 went from about 4,516 to about 7,669 by September 2026. CAPE is a guide to long-run expectations, and it's no use for timing. The overlapping ten-year windows also mean there are only about 13 truly independent decades in the sample.