Henry Hub: where the seasonality is
Natural gas is famous for winter. I wanted to know whether that shows up in the price, the volatility or both, and whether a seasonal time-series model forecasts next month's price better than just using this month's.
- Built with
- Python, pandas, statsmodels
- Data
- EIA daily Henry Hub spot price, 1997 to 2026
- Method
- Rolling one-month forecasts, Diebold–Mariano test
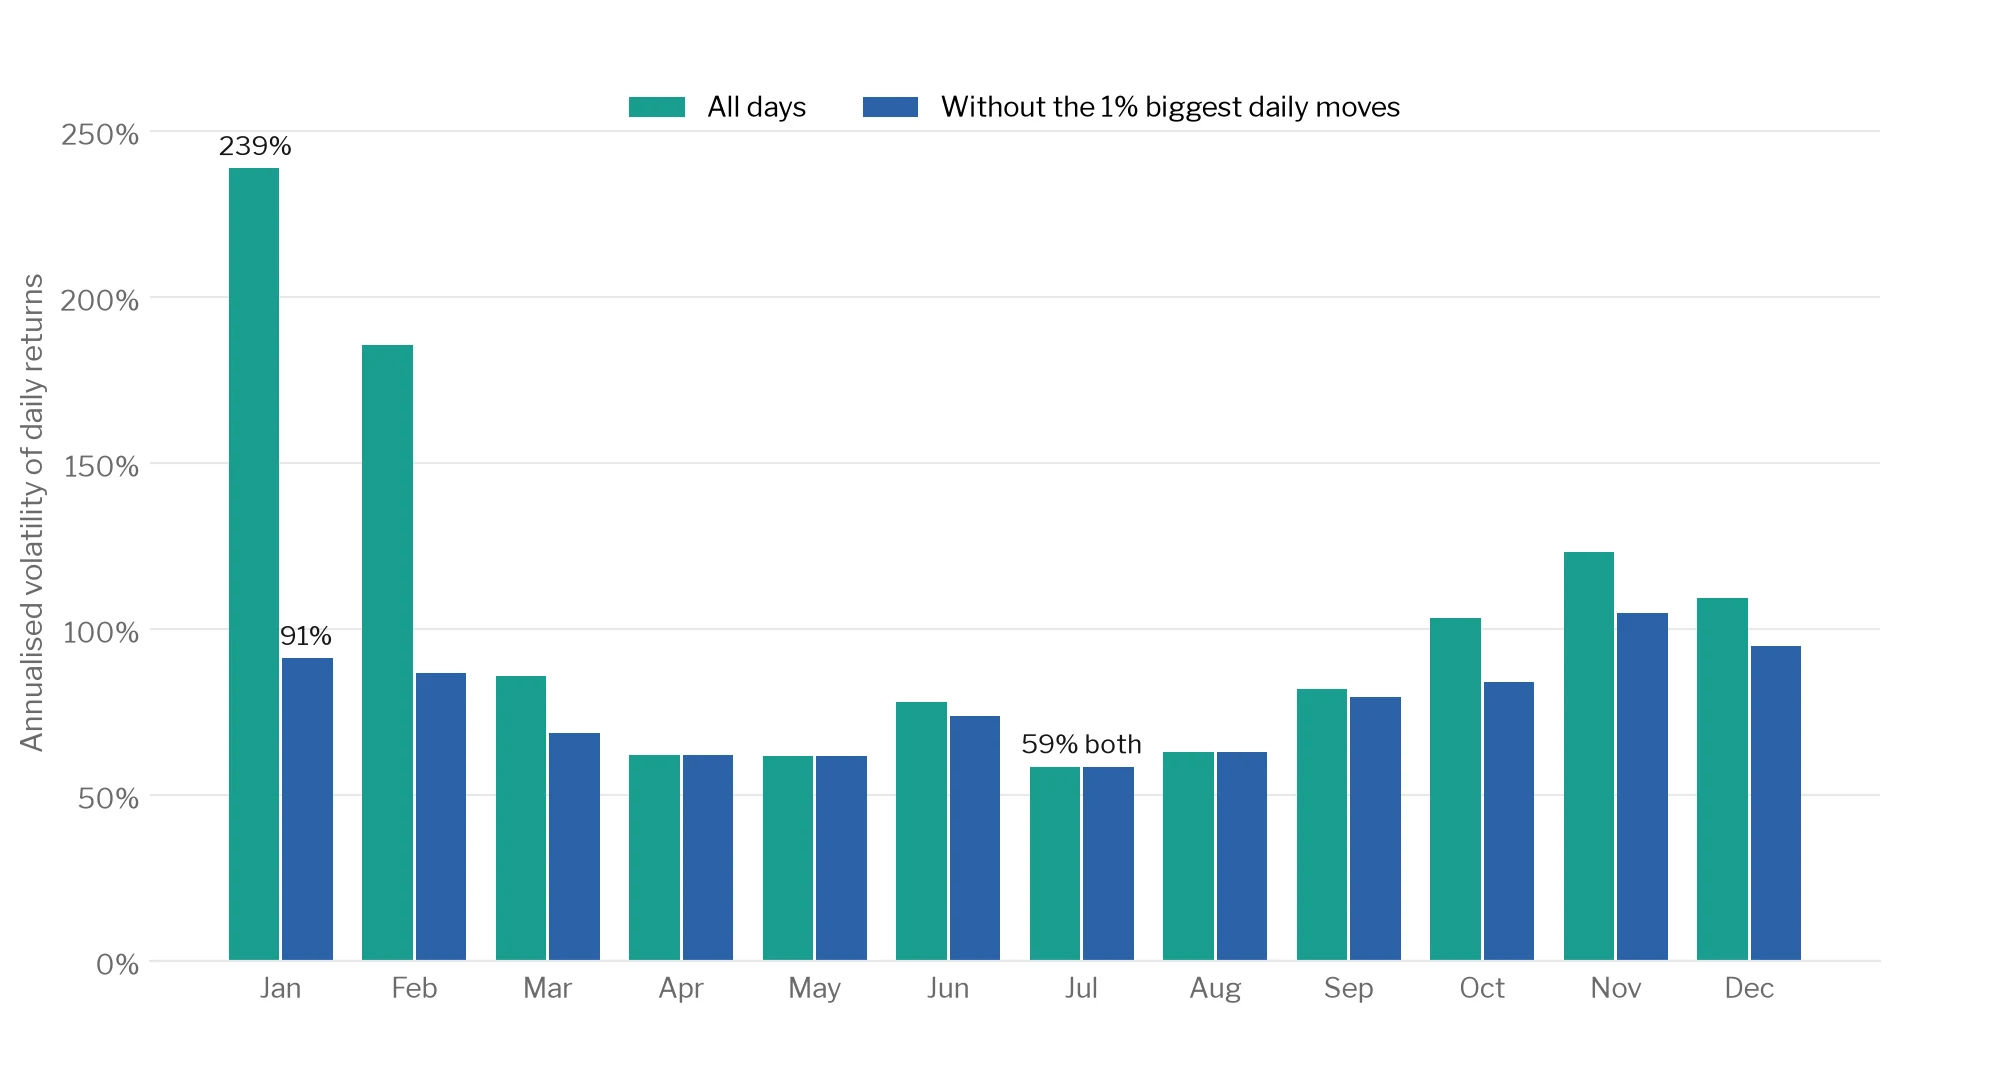
The volatility
January is about four times as volatile as July: 239% against 59% annualised. A handful of cold snaps drive much of that. Take out the biggest 1% of daily moves and January drops to 91%, but November to February are still the four most volatile months.
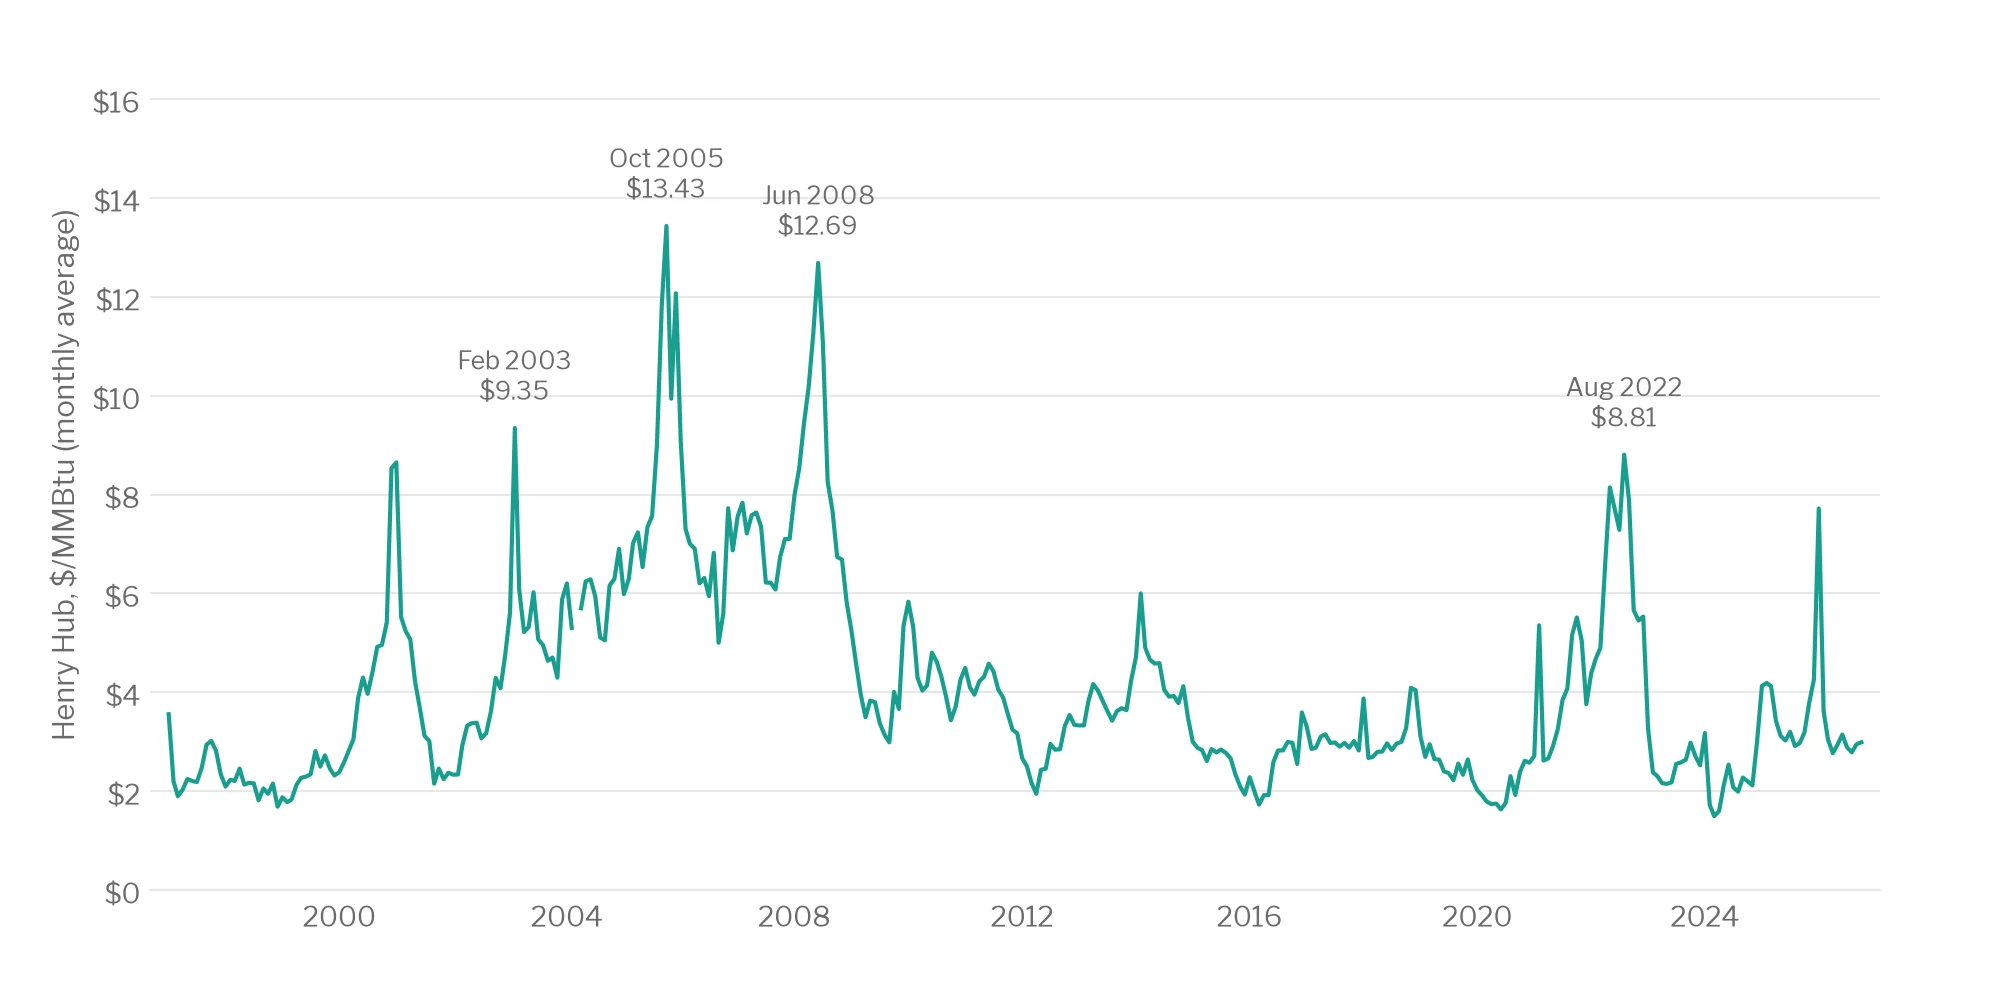
The price
The seasonal pattern in the price itself is smaller than people expect. December and January average about 8% above their year, and March and April 7% and 5% below.
| Forecast of next month's average price | Average miss | Diebold–Mariano vs random walk |
|---|---|---|
| Random walk (last month's price) | 12.7% | – |
| ARIMA(1,1,1) | 12.8% | p = 0.21 |
| Seasonal ARIMA(1,1,1)(1,0,0,12) | 12.8% | p = 0.36 |
202 monthly forecasts from January 2010 to October 2026, each fitted only on data before that month.
What I took from it
Neither model beat the naive forecast. Month to month, Henry Hub behaves close to a random walk, so any seasonal edge is more likely to be in volatility and options than in calling next month's price.