How risky is a barrel of Brent?
I backtested three ways to set a one-day 99% Value-at-Risk on a long Brent position, over 4,765 trading days from January 2008 to November 2026. At 99%, a good model should be beaten on about one day in a hundred.
- Built with
- Python, arch, SciPy
- Data
- EIA daily Brent spot price, 1987 to 2026
- Tests
- Kupiec proportion of failures, Christoffersen independence
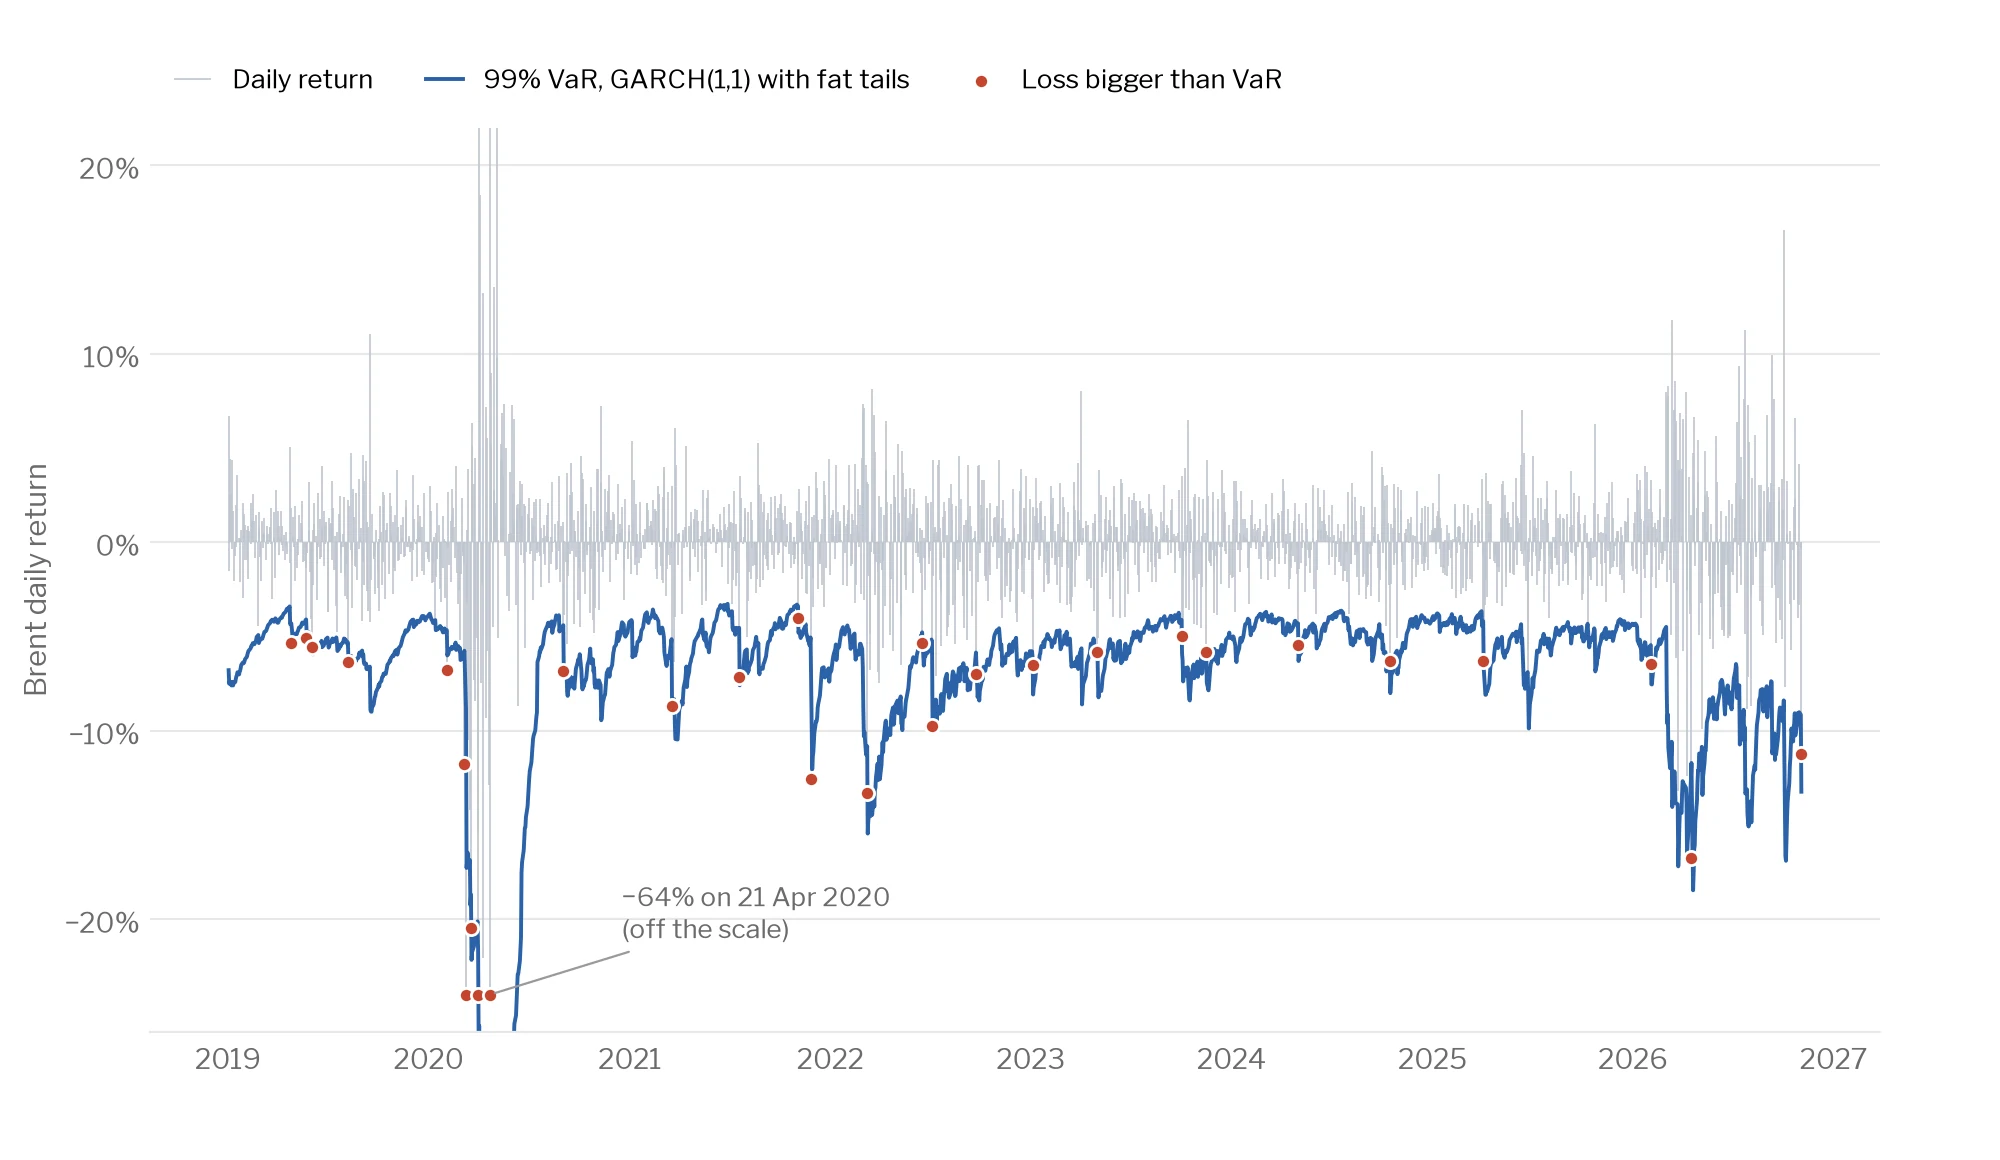
The three models
Historical simulation takes the worst 1% of the last 250 days. EWMA is the RiskMetrics approach: an exponentially weighted variance with a normal distribution. The third is a GARCH(1,1) with Student-t errors, refitted every 21 trading days on the previous 2,000 returns. Every day's VaR uses only data from before that day.
| Model | Days beaten | Rate | Kupiec p | Indep. p |
|---|---|---|---|---|
| Historical simulation, 250 days | 83 | 1.74% | <0.001 | 0.02 |
| EWMA, normal (RiskMetrics) | 90 | 1.89% | <0.001 | 0.36 |
| GARCH(1,1), Student-t | 59 | 1.24% | 0.11 | 0.76 |
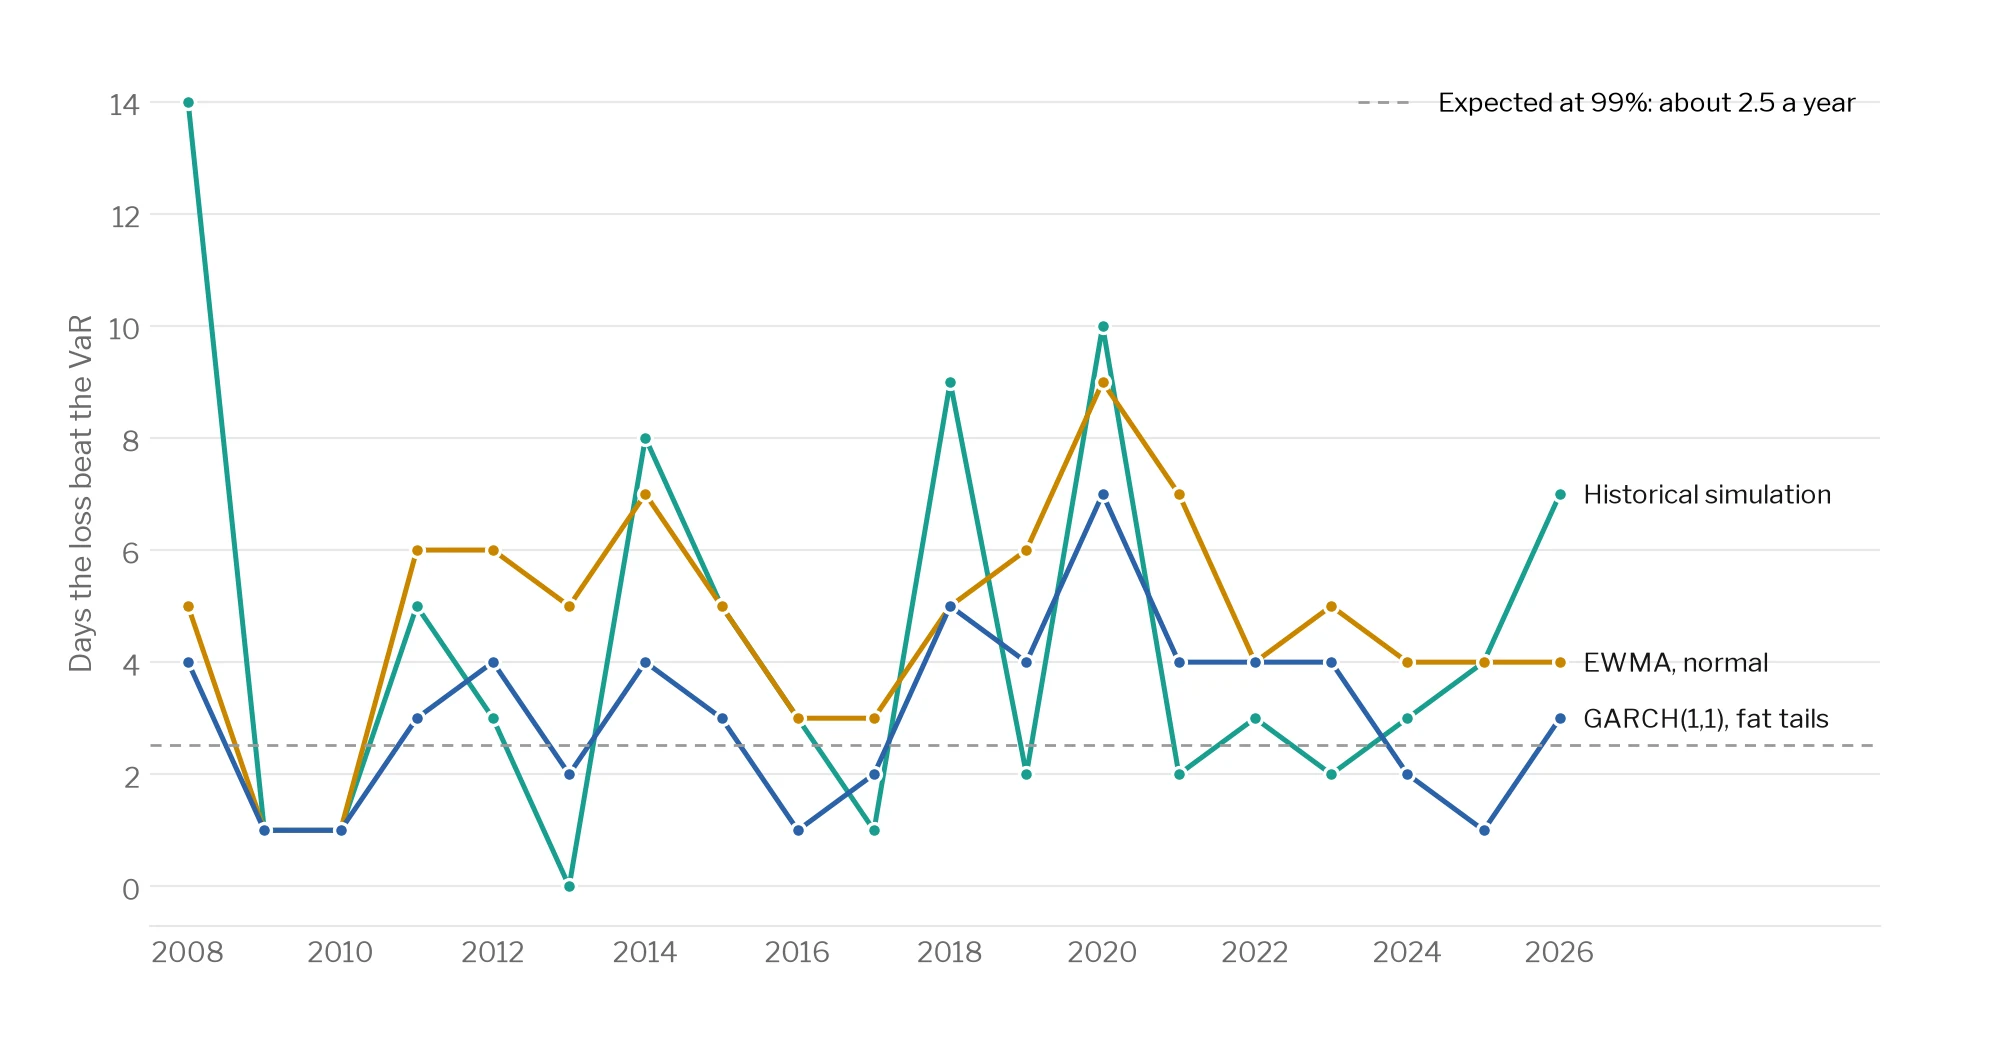
Expected at 99%: about 48 days out of 4,765. A Kupiec p-value below 0.05 means the model is beaten too often; a low independence p-value means its misses come in clusters.
What the tests say
Both simple models were beaten far too often: historical simulation 83 times and the normal EWMA 90 times, against about 48 expected. The GARCH model with fat tails was beaten 59 times, 1.24% of days, and passes both tests.
The fitted models explain why. The median Student-t had about 6.6 degrees of freedom, far fatter tails than a normal distribution, and volatility was very persistent (alpha plus beta about 0.99).
Where VaR stops
The worst day in the sample was 21 April 2020, when Brent spot fell from $17.36 to $9.12 in a day. No model came close to that, which is why I'd always run VaR next to stress tests and scenario analysis.